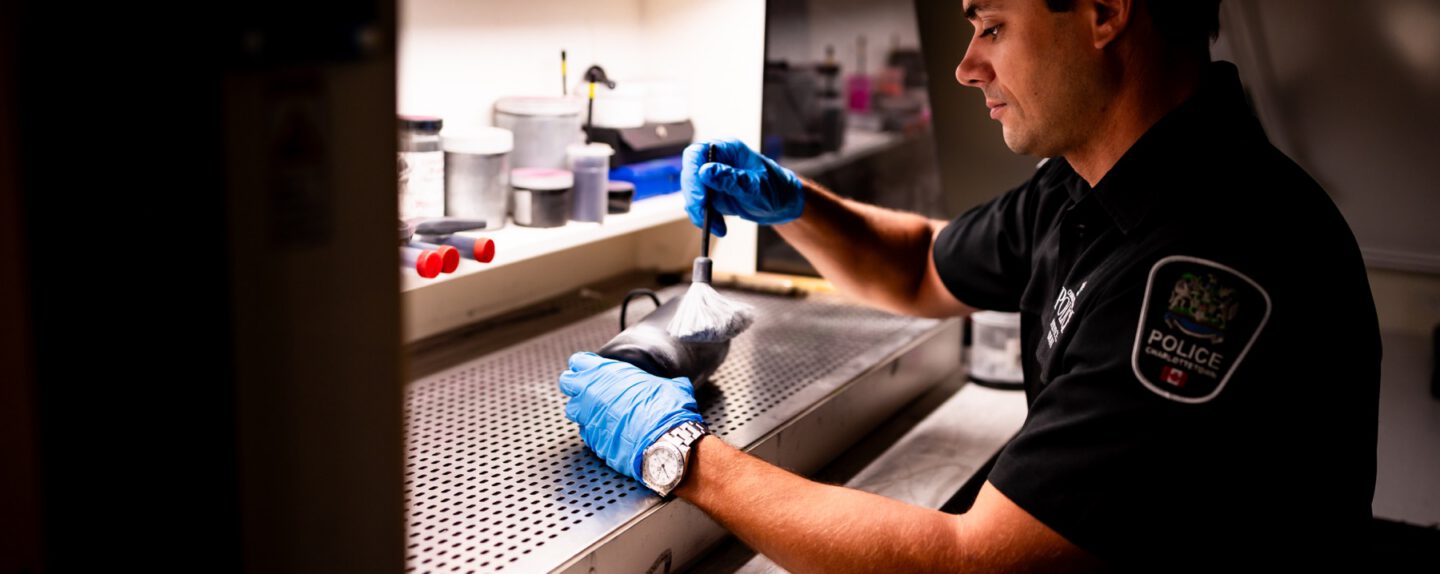
The monthly crime stats provide a snapshot of the calls for service to Charlottetown Police Services.
| Robbery |
1 |
1 |
2 |
|
0 |
— |
— |
| Serious (Murder) |
0 |
0 |
1 |
|
0 |
— |
— |
| All Type Assaults |
43 |
37 |
307 |
|
20 |
— |
1435% |
| Sexual (Sex assault, Voyeurism) |
7 |
7 |
51 |
|
9 |
— |
467% |
| Sexual Child Related |
0 |
0 |
39 |
|
7 |
— |
457% |
| Threats |
44 |
38 |
273 |
|
32 |
— |
753% |
| Hate Crimes |
|
0 |
12 |
|
|
— |
— |
| Total Crimes Against Persons |
95 |
83 |
685 |
0 |
68 |
— |
907% |
| Break & Enter |
17 |
12 |
89 |
|
14 |
— |
536% |
| Theft Under $5000 |
48 |
42 |
329 |
|
42 |
— |
683% |
| Theft from Motor Vehicles |
13 |
13 |
68 |
|
9 |
— |
656% |
| Theft of Motor Vehicles |
6 |
2 |
21 |
|
2 |
— |
950% |
| Shoplifting |
8 |
8 |
90 |
|
11 |
— |
718% |
| Mischief Under $5000 |
28 |
28 |
273 |
|
28 |
— |
875% |
| Frauds |
30 |
27 |
181 |
|
13 |
— |
1292% |
| All Other Property Crimes |
|
31 |
245 |
|
32 |
— |
666% |
| Total Property Crimes |
150 |
163 |
1,296 |
0 |
151 |
— |
758% |
| All cc Driving & Impaired |
57 |
38 |
257 |
|
30 |
— |
757% |
| Controlled Drugs and Substances Act (CDSA) |
12 |
12 |
143 |
|
|
— |
— |
| All Other Criminal Code |
91 |
88 |
625 |
|
66 |
— |
847% |
| Total Impaired / CDSA / Other |
160 |
138 |
1,025 |
0 |
96 |
— |
968% |
| Parking |
1,676 |
1,676 |
13,174 |
|
|
— |
— |
| Nuisance |
59 |
58 |
404 |
|
|
— |
— |
| Dog |
6 |
6 |
51 |
|
|
— |
— |
| Liquor Control Act (LCA) |
15 |
14 |
187 |
|
|
— |
— |
| Total Municipal Bylaws |
1,756 |
1,754 |
13,816 |
0 |
0 |
— |
— |
| Highway Traffic Act (HTA) |
75 |
75 |
943 |
|
|
— |
— |
| HTA Violations |
|
116 |
1,427 |
|
|
— |
— |
| Other Traffic |
7 |
7 |
89 |
|
|
— |
— |
| Motor Vehicle Collisions |
|
95 |
856 |
|
|
— |
— |
| Total HTA & MVC's |
82 |
293 |
3,315 |
0 |
0 |
— |
— |
| Attempt/Threat of Suicide |
|
36 |
239 |
|
|
— |
— |
| Mental Health Act |
|
94 |
757 |
|
|
— |
— |
| Wellbeing Check |
|
80 |
695 |
|
|
— |
— |
| Total Mental Health |
0 |
210 |
1,691 |
0 |
0 |
— |
— |